Changes:
- Add ability to zoom closer than
one sample per pixel, so as to see the interpolated
signal level between samples.
- Add oversampling control to the spectrogram and
spectrum layers.
- Highlight and label frequency peaks in the
spectrum as the mouse rolls over them, when enabled
in the parameter area.
- Add feature to convert and import audio from a CSV
data file.
- Add some new colour maps, and restore the old Blue
on Black one.
- Speed up spectrum rendering at high resolutions.
- Fix failure to pass Nyquist bins correctly to
frequency-domain-input Vamp plugins in some
circumstances.
- Fix sometimes incorrect shortcut associations for
new-layer menu items.
- Various other rendering improvements and bug
fixes.
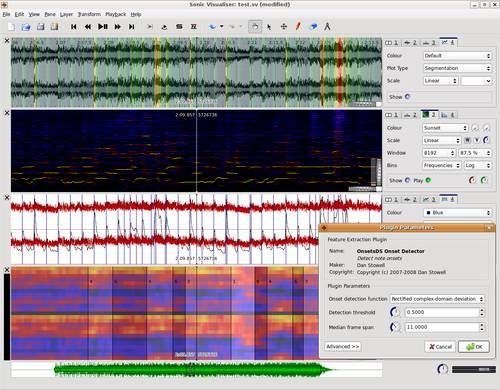
Sonic Visualiser is
an application for viewing and analysing the
contents of music audio files. The aim of Sonic
Visualiser is to be the first program you reach for
when want to study a musical recording rather than
simply listen to it.
Sonic Visualiser is Free Software,
distributed under the GNU General Public License (v2
or later) and available for Linux, OS/X, and
Windows. It was developed at the Centre for Digital
Music at Queen Mary, University of London.
Visit:
sonicvisualiser.org